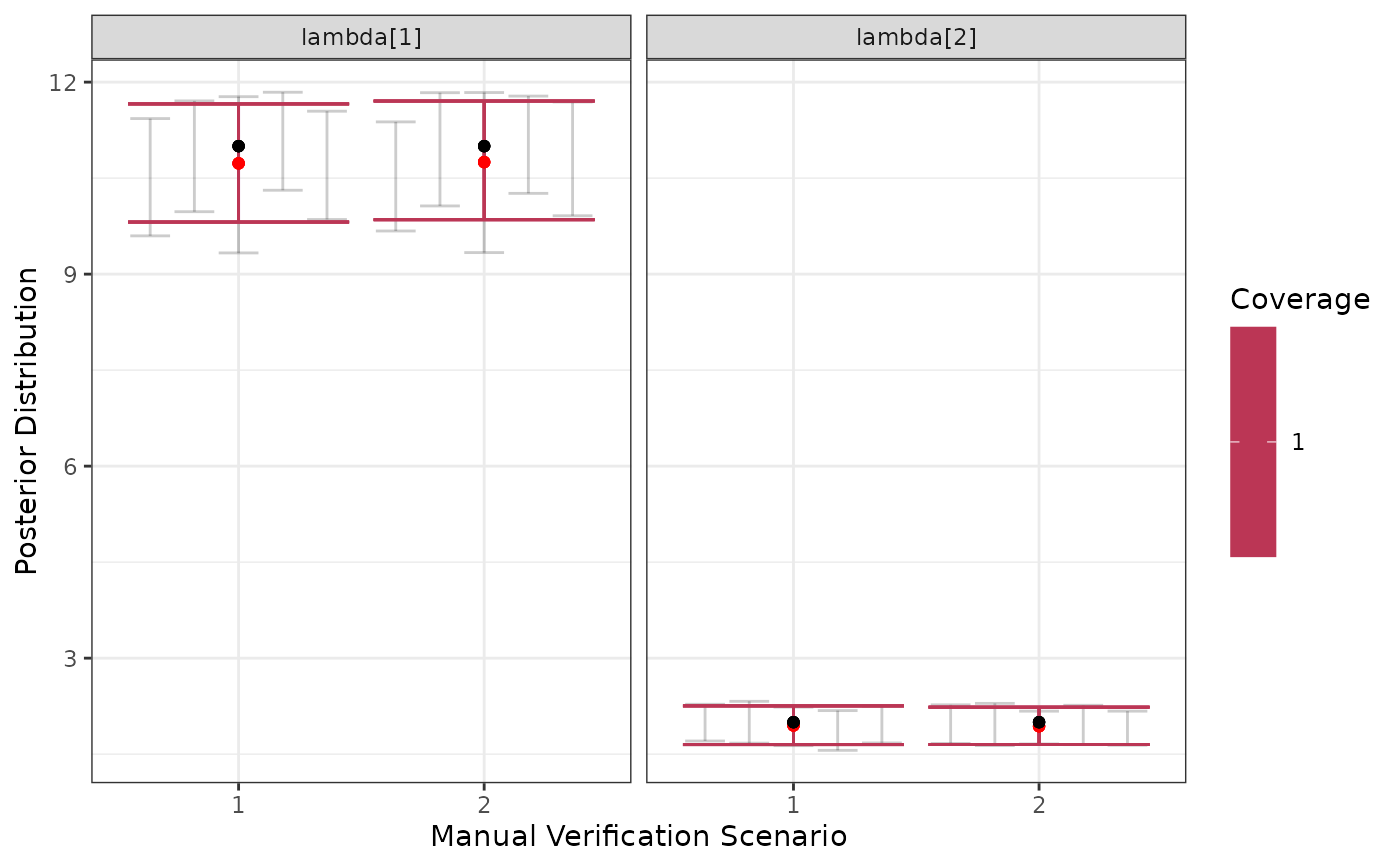
Visualize simulation results for entire groups of parameters
Usage
visualize_parameter_group(
  sim_summary,
  pars,
  theta_scenario,
  scenarios,
  convergence_threshold = 1.1
)
Arguments
- sim_summary
Summary output in the format of
run_sims().- pars
The parameters to be visualized.
- theta_scenario
The theta scenario IDs. This should match the
theta_scenario_idargument ofrun_sims().- scenarios
Scenarios to be visualized.
- convergence_threshold
If the Gelman-Rubin statistic is below this value, consider an MCMC to have converged. Default value is 1.1, but we recommend 1.05.